


Abstract
Gallium nitride (GaN) power amplifiers (PAs) have enabled modern phased array radar performance to greatly exceed prior generations with their high power density, reducing the need for bulky and lossy combining networks. This article will focus on GaN PA pulse droop as a nonideality of real-world radar performance and will discuss what can be done to mitigate its negative impact on radar range. With advanced solid-state electronics inserted at the output stages for many radar RF chains, system engineers can set specifications to achieve improved range, resolution, and sensing capabilities. Finally, the article will discuss devices that minimize pulse droop to meet the demands of today’s high performance phased array radars.
Background
Most modern radars use some form of pulse compression to improve the range resolution and signal-to-noise ratio (SNR). As a result, maintaining the integrity of the transmitted pulse through the signal chain is crucial. Pulse compression schemes allow radars to distinguish multiple targets in a tight grouping, whereas a long-range long-pulse radar might blur multiple objects together as return pulses overlap at the receiver. Targets reflect radar pulses differently, and for the receive algorithms to identify what the radar is seeing, the transmitted pulse needs to maintain a predictable shape. All aspects of a radar pulse are important for the radar to achieve its intended sensing goals, dictated by the use case—some radars search for aircraft, while others monitor weather patterns. A typical radar pulse and its characteristics are shown in Figure 1.
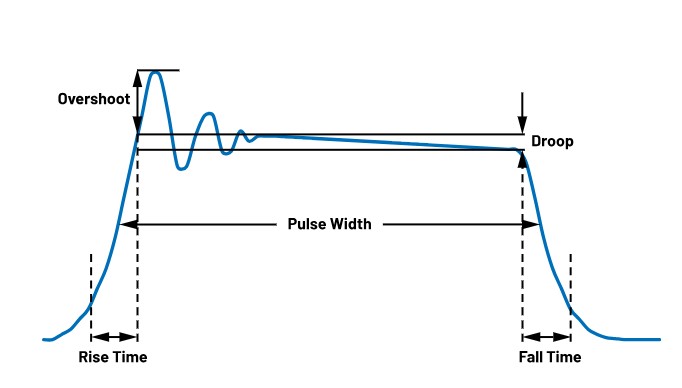
The combination of rise and fall times, peak amplitude, pulse width, and duty cycle combines to help define the range, sensitivity, thermal, and power design targets for a radar. One aspect that has received increased attention as the more noticeable challenges have been overcome is pulse droop, which is the reduction in amplitude of the radar pulse from the beginning to the end of the pulse, typically given in dB. In a radar, pulse droop equates to range reduction over the length of the pulse—the combination of pulse amplitude and pulse width determines the range of the radar as an integrated power level.
The radar equation, as it is known, defines the trade-offs and their interdependencies:
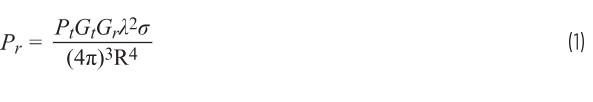
The radar equation relates factors of the radar performance and practical effects to give an approximation for performance, where Pr is the expected receive power, Pt is the transmit power, Gt is the antenna gain, Gr is the receive gain, λ is the wavelength of radar operation, σ is the effective cross-sectional area of the target, and R is the range from the antenna to the target. The radar equation shows that any negative impact to the transmit power will have a detrimental effect on radar performance, as range losses dominate with the round-trip attenuation raised to the fourth power in the denominator—overcoming range losses requires every bit of available power.
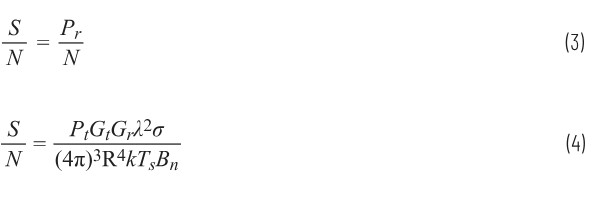
The radar equation is a good tool for approximating receive power for a given target at range; however, it largely ignores the many sources of noise that compete with the target echo. Noise power,
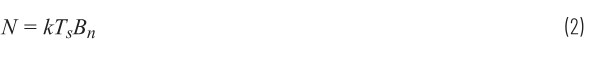
where k is Boltzmann’s constant, Ts is the system noise, and Bn is the noise bandwidth of the receiver, gives us the SNR, and can be integrated into the radar equation for an expression of SNR at the radar:
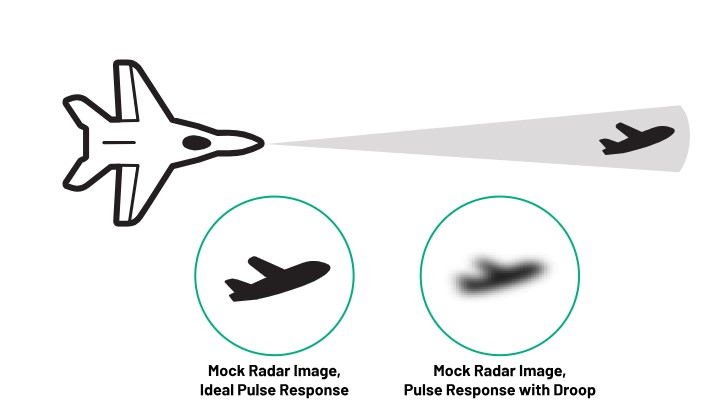
The SNR describes the radar’s ability to detect a target at a given range from the radar, including noise sources intrinsic to the radar. Looking at the impact of pulse droop through the lens of SNR, reducing the transmit power decreases the SNR, hampering the ability of the radar to detect objects at range. Figure 2 shows the impact of pulse droop on reducing the range and sensitivity of airborne pulsed radar.
Pulse Droop in GaN Amplifiers
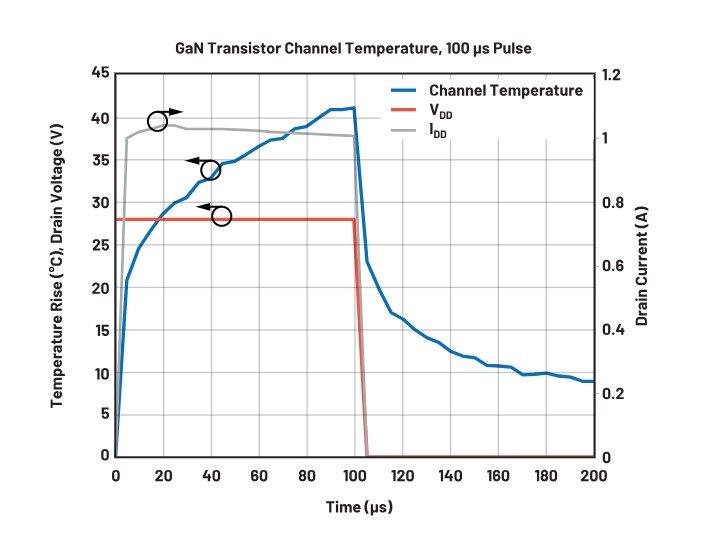
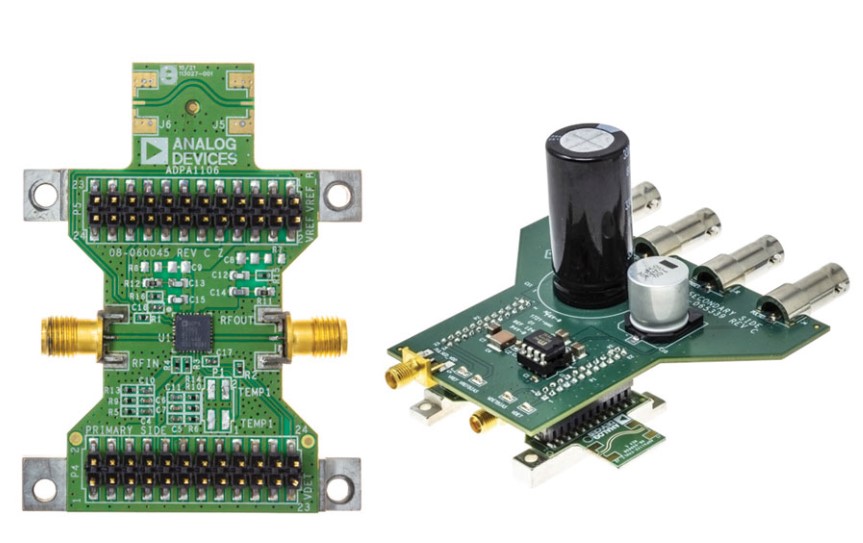
High power GaN PAs for pulsed radar have been observed to have comparable pulse droop to their vacuum tube predecessors. As the PA transistor channel temperature increases due to Joule self-heating, which is the product of current density and electric field, the output power of the amplifier is reduced. Figure 3 shows the active channel of a GaN transistor undergoing self-heating during a 100 μs pulse using a benchtop power supply to drive the voltage and current, and a Microsanj thermoreflectance system to measure channel temperature in the bulk GaN. Current draw decreases along the pulse in response to self-heating effects, and in large arrays often the supply voltage sags as power banks discharge under high current loads. To mitigate the voltage sag, it is common to see large charge storage capacitors along the bias line in addition to ceramic or tantalum bypass capacitors close to the PA, as shown in Figure 4. However, the associated drawbacks of pulse shape deformation and increased array size, weight, and cost make large storage capacitors a nonideal solution.
While specifications for pulse droop vary from system to system, minimizing droop can only benefit the radar performance. Nominally, amplifiers with 0.5 dB or less of pulse droop are optimal for radar applications, and pulse droop in the range of 0.3 dB or better is greatly preferred by system designers.
Managing Pulse Droop
Managing the pulse conditions in the field is just one of the viable methods for handling pulse droop performance. Off-chip, bypassing capacitor selection on both the gate and drain supplies of the amplifiers drives the performance of rise and fall times. Even the relative position to the amplifier, orientation, and material selections for decoupling capacitors can impact pulse fidelity. Designing circuits operating at RF frequencies means impedances are more than just a function of component capacitance, and the impact of parasitic capacitance and inductance generally increases with frequency.
Further from the PA, possibly closer to the power supply or in a nearby power control board, large storage capacitors offer another method for reducing pulse droop. Storage capacitors maintain the voltage generated by the source during the pulse, relieving the switching regulator from handling the increased power load. Each off pulse, the storage capacitors are recharged and ready to support the following on pulse. As discussed before, there are size, weight, and cost drawbacks to storage capacitors, but nonetheless many radar installations use them to even out power over pulse conditions.
In the lab, benchtop supplies are designed to be resilient to the reactive forces of driving pulsed signals. In the field, radar power supplies are typically designed to drive clean pulses as well, though the magnitude of the required current in the radar can lead to voltage sag from the supplies and in turn drive another source of RF pulse droop. Power system designers have come up with novel techniques to manage voltage sag through droop compensation circuits and software-based pulse modulation schemes.
Other methods such as pulse shaping via digital feedback, predistortion techniques, and feed-forward power supply designs have been evaluated to varying degrees of success. Often these techniques are difficult to implement and the improvement in pulse performance is not worth the overhead of additional hardware or software complexity.
GaN PA Pulse Shape in the Lab
Using one of ADI’s S-band radar PAs, the ADPA1106, as a test vehicle, measurements were taken to test the impact of pulse width and duty cycle on pulse droop.
The test setup contained an arbitrary waveform generator triggering a bench power supply and a pulsed RF source to generate the pulsed DC and RF power waveforms for the PA input. The output of the PA was connected to a Keysight N1924A power meter feeding a Keysight 8990B Peak Power Analyzer. The base-plate temperature was controlled using a chiller plate set to 25°C. Figure 5 shows a typical measurement of an ADPA1106 pulse.
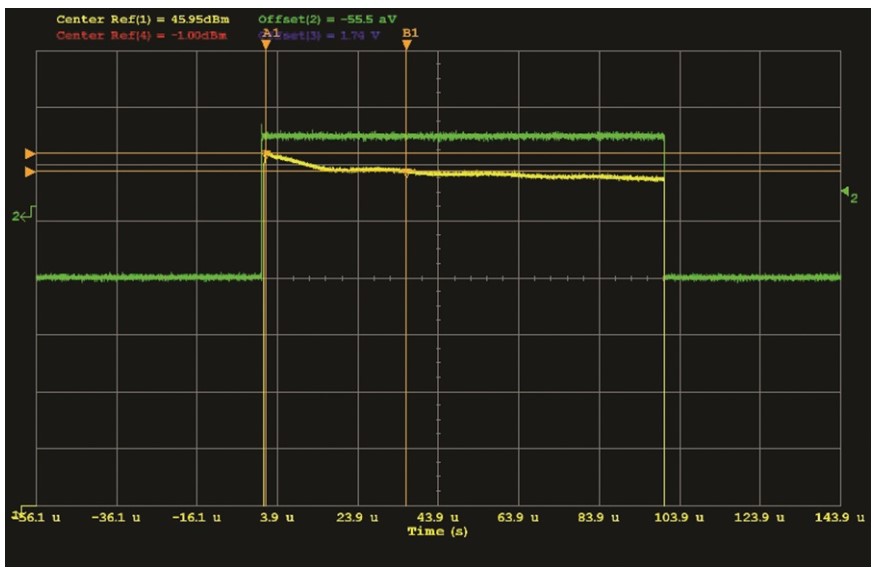
We can see in Figure 5 that the typical ADPA1106 pulse shape characteristics are very attractive for use in pulsed radar systems—fast rise and fall times, little to no overshoot, and acceptable droop within 0.3 dB. The green trace is the drain voltage pulse and the yellow trace is the RF output of the PA.
Varying Pulse Width
To gain further insight into how the ADPA1106 performs across pulsed widths and duty cycles, the PA was tested by varying the pulse width under constant pulse repetition frequency (PRF), and again with varying duty cycle while maintaining constant pulse width. Pulse droop was measured from 2% into the pulse through the end of the pulse to remove the effect of the initial overshoot. Pulse overshoot is primarily driven by pulse signal filtering and the power supply solution in the system and is not indicative of the intrinsic amplifier performance. Other studies have suggested measuring droop from 10% to 90%, or even 25% to 75% of the pulse width, to remove the impacts of overshoot and ripple. However, removing the ripple discounts a significant portion of the linear droop seen in the data. Here, only the initial overshoot has been removed from the droop calculation. Figure 6 and Table 1 show the results of this set of experiments.
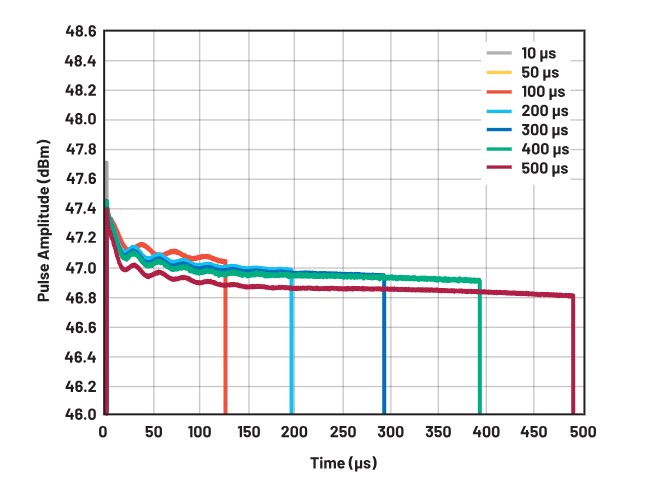
| PRF | Pulse Width (µs) | Pulse Droop (dB) | Average Output Power (dBm) |
| 1 ms | 10 | 0.11 | 47.63 |
| 50 | 0.24 | 47.24 | |
| 100 | 0.29 | 47.13 | |
| 200 | 0.36 | 47.03 | |
| 300 | 0.39 | 47.02 | |
| 400 | 0.43 | 46.97 | |
| 500 | 0.46 | 46.87 |
This set of data, shown in Figure 6 and Table 1, gives clear examples of the typical pulse shape described previously—the initial overshoot, the pulse shape settling, and the pulse droop. As would be expected, there is a strong correlation between increasing pulse width and increasing pulse droop under a fixed pulse repetition frequency. At the maximum tested pulse width, the droop approaches 0.5 dB, the preferred maximum level of droop at the system level. Additionally, due to thermal effects, we see the peak and average output power decreasing slightly with increasing pulse width. There is a slight increase in the downward slope at the tail end of the longest pulse width, which may be an indication that self-heating effects are beginning to impact the thermal management solution of the package and heatsink below.
Varying Duty Cycle
The ADPA1106 was then tested with a constant pulse of 100 µs and changing the duty cycle. Droop was measured the same as before, from 2% into the pulse through the end of the pulse to remove the impact of the pulse overshoot.
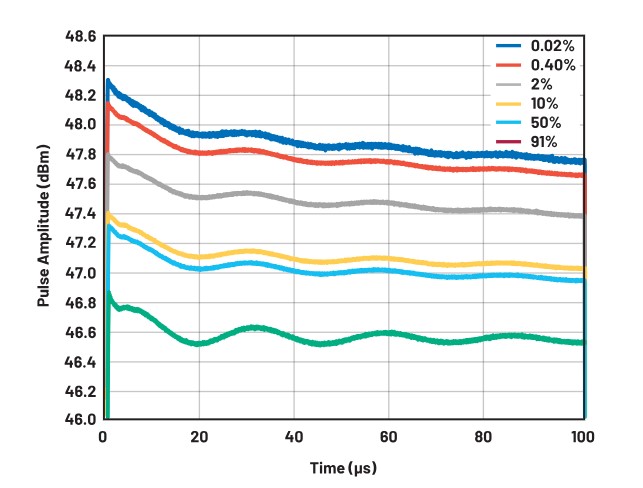
| Pulse Width | Duty Cycle (%) | Pulse Droop (dB) | Average Output Power (dBm) |
| 100 µs | 0.02 | 0.45 | 47.89 |
| 0.4 | 0.39 | 47.77 | |
| 2 | 0.33 | 47.49 | |
| 10 | 0.29 | 47.11 | |
| 50 | 0.28 | 47.03 | |
| 91 | 0.23 | 46.58 |
As the duty cycle increases at constant pulse width, the time the PA spends off between pulses decreases. This means that the PA has less time to cool between pulses and is at a higher temperature at the rising edge of the subsequent pulse. In the limiting case of a 100% duty cycle (continuous wave or CW), there is no time for the PA to cool and the PA’s temperature is constant at its maximum. Therefore, as the duty cycle increases, the average temperature of the part increases, but the magnitude of the temperature rise during the pulse decreases. This results in reduced peak and average output power due to the higher absolute temperature of the part. It also means there is less droop over the pulse width because the PA’s temperature changes less over the duration of the pulse. This can be seen in Figure 7 and Table 2.
GaN devices generate a lot of output power. Although efficiency in GaN is relatively high, some power conversion is lost to heat, and effective thermal management is required for best results. Here, a liquid-cooled temperature-controlled baseplate was used to manage the thermal rise; similar thermal solutions are used in the field. In extreme cases of poor thermal management, the fidelity of the output waveform will degrade, reducing radar sensitivity.
GaN Radar PAs
ADI continues to develop and release high performance GaN PAs targeting military and civil radar and electronic warfare (EW) applications. Radar systems are often banded in frequency depending on their intended use cases—for instance, S-band radar is often used for long-range tracking applications like air traffic control, weather radar, and surface tracking radars, while X-band radar is often used for marine and fire control radar. Each of these use cases demands performance, including low pulse droop.
The ADPA1106 test vehicle used to measure droop here is a GaN PA that delivers 46 dBm (40 W) with 56% power added efficiency (PAE) across a bandwidth of 2.7 GHz to 3.5 GHz. The typical performance of some of ADI’s other GaN radar PAs is summarized in Table 3.
| ADPA1105 | ADPA1106 | ADPA1107 | ADPA1122 | |
| IEEE radio band | L-band | S-band | C-band | X-band |
| Frequency | 0.9 GHz to 1.7 GHz | 2.7 GHz to 3.5 GHz | 4.8 GHz to 6 GHz | 8.2 GHz to 11.8 GHz |
| Linear gain | 36 dB | 34 dB | 30 dB | 33 dB |
| Power gain | 19 dB | 25 dB | 20 dB | 21.5 dBm |
| PSAT | 46 dBm | 46 dBm | 45 dBm | 43 dBm |
| PAE | 60% | 56% | 57% | 46% |
Conclusion
While the increasing demands of radar systems continue to raise the bar for individual component performance, ADI’s line of GaN radar PAs is ahead of the demand curve. Benchtop experiments have shown exceptional pulse droop performance of less than 0.3 dB for a range of pulse conditions in ADI’s high efficiency, high output power S-band GaN PA, the ADPA1106.


 combined with superior switching performance")


